四捨五入と銀行丸めの”丸め誤差”
四捨五入に似たものとして銀行丸め(偶数丸め)があります。Pythonのように、プログラム言語によっては標準的に銀行丸めが採用されているものもあります。なぜ四捨五入だけでなく、敢えて似たものが発明されているのでしょうか
感覚的に、四捨五入はプラス方向に誤差が出やすいことが分かります。というのは、切り捨て側に働く場合は4つありますが、切り上げ側に働く場合が5つあるからです。
1.0~1.9を四捨五入して整数にしたとき1または2になりますが、+0.5だけが相殺されません。

それに対し銀行丸めは、+0.5も相殺されるように考えられています。

詳しくは下記の関連記事を参照ください。
100個の値~1000個の値で丸め誤差の合計値を比較する
ランダムな数値を100個、110個、120個…1000個用意し、四捨五入と銀行丸めの誤差の変化を比較してみます。
import numpy as npdef my_round(x, decimals=0):
return np.floor(x * 10**decimals + 0.5) / 10**decimalsdef main():
round_list = np.empty(0)
even_list = np.empty(0)
for x in range(start,end,span):
rng = np.random.default_rng()
#ランダムな小数リストの作成
numlist = np.round(rng.random(x)* 10, decimals=1)
#print(numlist)
round_val = my_round(numlist) #四捨五入
even_val = np.round(numlist, 0) #銀行丸め
#print(even_val)
#print(round_val)
#差分を計算
diff_round = my_round(np.sum(round_val - numlist) ,1)
diff_even = my_round(np.sum(even_val - numlist),1)
#print('--- diff ---')
#print('even',diff_even)
#print('round:',diff_round)
#差分を蓄積
round_list = np.append(round_list, diff_round)
even_list = np.append(even_list, diff_even)
graph(round_list, even_list)import matplotlib.pyplot as plt
def graph(rnd, evn):
fig, ax = plt.subplots()
t = np.arange(start,end,span)
c1,c2 = "blue","red" # 各プロットの色
l1,l2 = "rounding", "even rounding" # 各ラベル
ax.set_xlabel('n') # x軸ラベル
ax.set_ylabel('y') # y軸ラベル
ax.grid() # 罫線
ax.plot(t, rnd, color=c1, label=l1)
ax.plot(t, evn, color=c2, label=l2)
ax.legend(loc=0) # 凡例
fig.tight_layout() # レイアウトの設定
plt.show()
start = 100
end = 1000
span = 10

if __name__ == "__main__":
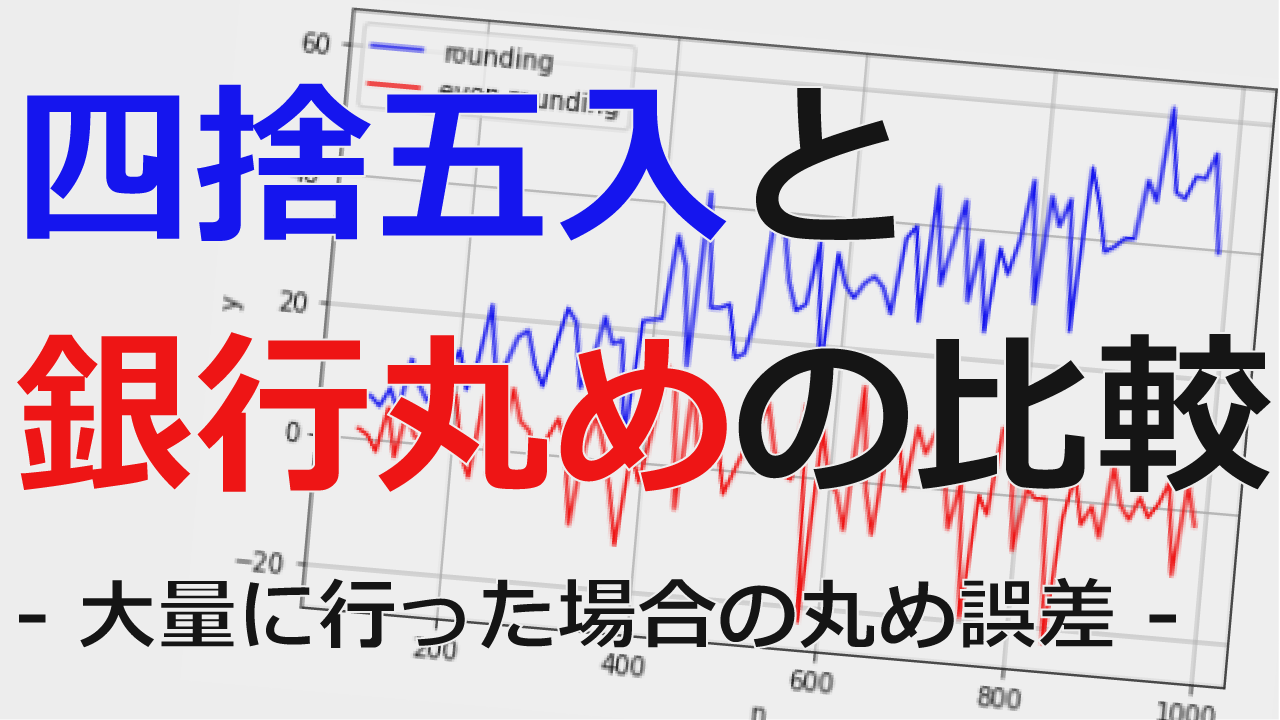
main()- 横軸 丸める対象にしたデータ数(100個~1000個)
- 縦軸 元の数値と丸めた後の数値のそれぞれの差分を合計した値
- 青グラフ 通常の四捨五入
- 赤グラフ 銀行丸め(偶数まるめ)

やはり感覚通り四捨五入は、値の数が増えるにつれ誤差が蓄積されて大きくなっています。
銀行丸めは0近辺をキープしていることから、大量のデータ処理を行うことを前提としているプログラム言語でROUNDが銀行丸め(偶数まるめ)を採用しているのも納得できます。
まとめ
- 四捨五入は誤差がプラスに偏る傾向がある
- 四捨五入がプラス誤差を蓄積するのに対し、銀行丸め(偶数まるめ)なら誤差0の近辺を保つことができる
リンク


コメント